 Image 1 of


Social Media Analytics Tracking Spreadsheet
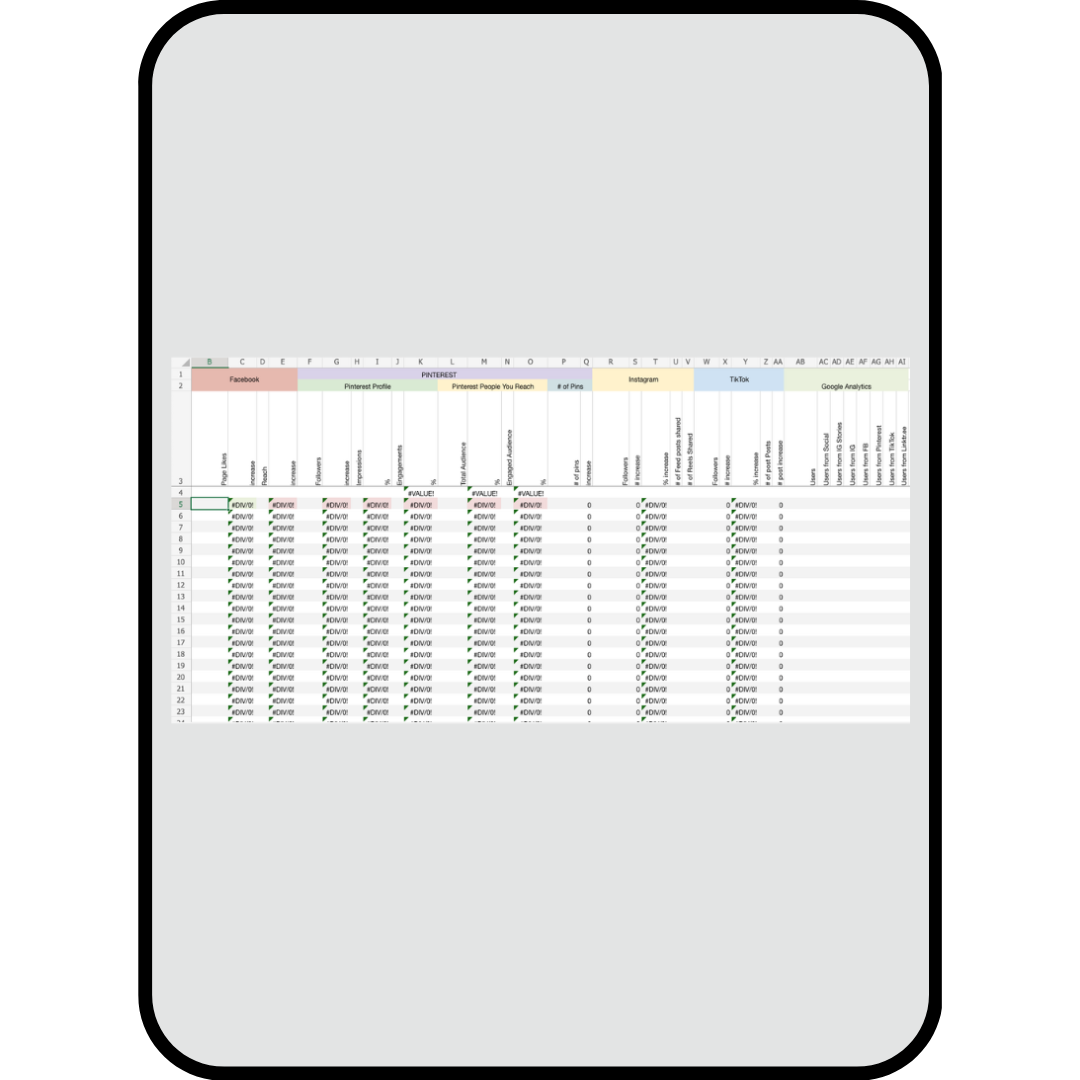
Need a better way to track analytics for social media and social media growth overall? We created this Social Media Analytics Tracking Spreadsheet that will help you track key performance indicators across Facebook, Instagram, Pinterest, and Google Analytics and measure their growth.
For an easy video tutorial on how to use this template, click here!
This Excel spreadsheet comes pre-filled with formulas to measure % increases and decreases from month to month (or any time period you wish). Just add data for the following metrics, and you can always customize the spreadsheet to your needs:
Facebook
Likes
Reach
Pinterest
Followers
Avg. Daily Impressions
Avg. Daily Viewers
Avg. Monthly Viewers
Avg. Monthly Engaged
Avg. Daily Saves
Avg. Daily Clicks
# of pins
Instagram
Followers
# of posts
Google Analytics
Website Users
Users from Social Media
Users from Facebook
Users from Instagram (+ Instagram Stories)
Users from Pinterest
Users from Linktr.ee
Looking for further guidance when it comes to navigating organic social media analytics? Unlock this download + more in Decode Your Data, a course on social media analytics.
Download is in the form of an .xlxs file, but can also be used as a Google Sheet
